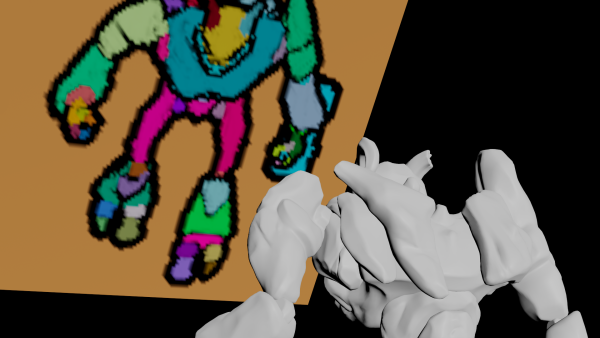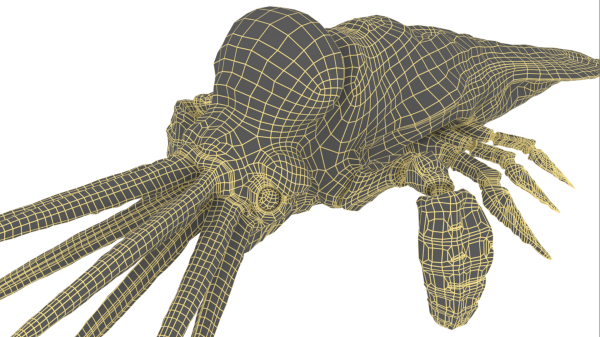
This procedure is a way to visualize Houdini geometry data in a web browser or any other application that can display SVG files. The resulting SVG file will contain one path element for each polygon in the geometry, and hovering over a path will increase its opacity due to the CSS style definition. The color and shape of each path correspond to the color and shape of the corresponding polygon in the Houdini geometry. The id and title of each group correspond to the class and name of the corresponding polygons in the Houdini geometry. The id and title can be used to identify and select specific groups of paths in the SVG file.
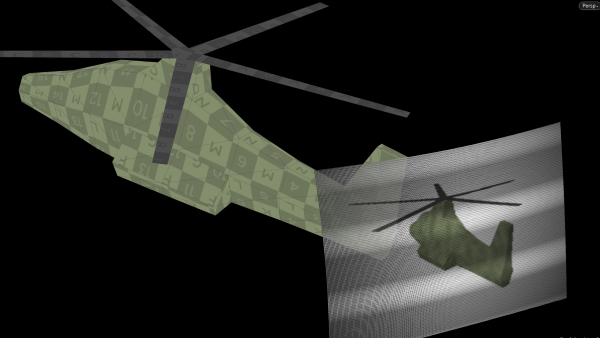
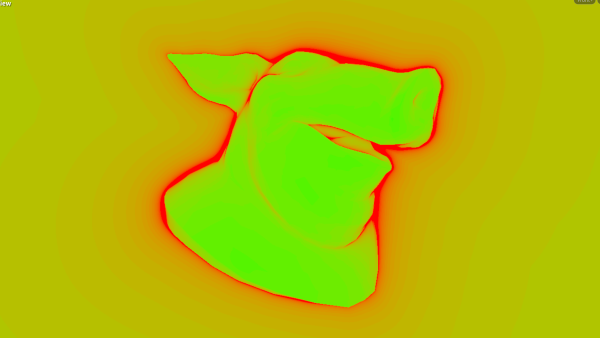
VEX point wrangle: Convert world positions to normal device coordinates (NDC) to display the camera's perspective on a 2D screen.
        string cam = chs('camera');

vector pos = toNDC(cam, v@P);
pos.y *= 9.0/16.0;
f@d = pos.z;
pos.z = 0.0;

v@P = pos;
Python script to generate an SVG (Scalable Vector Graphics) file from geometry data. This script is a tool for artists who want to create interactive graphics and animations with Houdini and SVG.
node = hou.pwd(): the current Houdini node.
geo = node.geometry(): the geometry from the current node.
file = node.evalParm('file'): the file parameter for the output file path for the SVG file.
res = node.evalParmTuple('res'): the resolution parameter to set the width and height of the SVG file.
The write_path function is defined to write a path element in the SVG file for each polygon in the geometry. It takes a file pointer, a list of points, and a color as arguments. If the list of points is not empty, it generates a path data string and a color string, and writes a path element to the file.
The with open(file, 'w') as fp: block opens the output file for writing. It writes the SVG header and a style definition to the file. Then it gets a set of all classes of polygon primitives in the geometry. For each class, it writes a group element to the file with an id and title. For each polygon primitive in the geometry that belongs to the current class, it gets the list of points and the color, and calls the write_path function to write a path element to the file. Finally, it writes the closing tag for the SVG file.
        node = hou.pwd()
geo = node.geometry()

file = node.evalParm('file')
res = node.evalParmTuple('res')

def write_path(fp, points, color):
  if not points:
    return
  data = ' '.join(['M{:.1f} {:.1f}'.format(points[0].x(), points[0].y())] + ['L{:.1f} {:.1f}'.format(p.x(), p.y()) for p in points[1:]])
  color_string = "rgb({},{},{})".format(color[0]*255, color[1]*255, color[2]*255)
  fp.write('<path d="{}Z" style="fill: {}; stroke: {}; stroke-width: 0.8px;"  class="s" />\n'.format(data, color_string, color_string))

with open(file, 'w') as fp:
  fp.write('<?xml version="1.0" standalone="no"?>\n')
  fp.write('<!DOCTYPE svg PUBLIC "-//W3C//DTD SVG 1.1//EN" "http://www.w3.org/Graphics/SVG/1.1/DTD/svg11.dtd">\n')
  fp.write('<svg width="{}px" height="{}px" version="1.1" xmlns="http://www.w3.org/2000/svg" >\n'.format(res[0], res[1]))
  fp.write('<defs>\n')
  fp.write('<style type="text/css"><![CDATA[\n')
  fp.write('.s { fill-opacity: 0.2; }\n')
  fp.write('g:hover .s { fill-opacity: 0.4; }\n')
  fp.write(']]></style>\n')
  fp.write('</defs>\n')

  classes = set([prim.attribValue('class') for prim in geo.iterPrims() if prim.type() == hou.primType.Polygon])

  for cls in classes:
    name = next((prim.attribValue('name') for prim in geo.iterPrims() if prim.attribValue('class') == cls), 'No name')
    fp.write('<g id="class_{}" title="{}">\n'.format(cls, name))
    for prim in geo.iterPrims():
      if prim.type() != hou.primType.Polygon or prim.attribValue('class') != cls:
        continue
      points = [v.point().position() for v in prim.vertices()]
      color = prim.attribValue('Cd')
      write_path(fp, points, color)
    fp.write('</g>\n')

  fp.write('</svg>')
The SVG file can be opened in a text editor and modified, or it can be opened in a web browser or graphics editor to view and manipulate the paths. The paths can be filled and stroked with different colors, and they can be transformed, animated, and interacted with using JavaScript and CSS. The SVG file can also be embedded in an HTML document, printed, or converted to other image formats.